|
StatPlanet 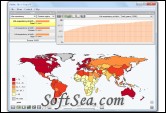
|
Interactive visualization of data through maps and graphs. StatPlanet is free software for creating interactive, customizable visualizations of various kinds of data - demographic, educational, health and socio-economic.
Data can be visualized in several forms: as thematic maps, bar charts, scatter plots and proportional symbol maps.
Additional options include: changing the appearance, modifying the map or graph scale, converting data to percentiles and defining custom regions.
Use this interactive educational software to learn or teach about the state of the world.
StatPlanet Features:
Cloropleth map:
* This is the main map type in StatPlanet. The legend window in the top-right corner of the screen allows you to customize both the map colours and the map scale. To adjust the map colours click on the top, middle or bottom colour and select a new colour. To adjust the map scale, click on the top or bottom value of the value range, then use the popup to increment or decrement the value, or enter a whole new value. The intermediate values or colours will be adjusted automatically.
Proportional symbol map:
* A proportional symbol map scales symbols (usually circles) according to the data they represent. To create one, click the proportional symbol map button in the bottom-left corner of the screen. The proportional symbol map is overlayed on top of the cloropleth map. If you have bookmarked an indicator, the symbol map represents the data for the bookmarked indicator, wherease the cloropleth map represents the data for the selected indicator.
Select regions (e.g. Sub-saharan Africa):
* use the drop-down menu in the top-right corner of the screen to select a region. You can also define a custom region using the Table.
Select country on the world map:
* Moving the mouse over a country on the world map brings up a popup containing information about that particular country for the selected indicator (as well as the bookmarked indicator, if there is one). When a country is selected, the country data for all indicators in the current category is shown in the indicators window, along with corresponding bars. The bars are scaled in proportion to the maximum value of that particular indicator for all countries in the selected region.
* See also selecting a country.
National maps:
* Iin the current version only the national map for Kenya has been implemented. To see the Kenya map, click on Kenya in the worldmap view. Click on the Kenya map again to go back to the worldmap view.
Map controls:
* Zoom: the map zoom controls are normally hidden from view. Move the mouse towards the bottom-right of the screen to make them appear. You can zoom in and out of the map using the zoom in and zoom out buttons, or by dragging the zoom slider up or down. If your mouse has a scroll wheel, you can also use this to zoom in and out.
* Moving the map: click and drag the map with the mouse to move it to a new position.
* Restore map position: the button shown on the left restores the map to the original coordinates for the selected region.
Graph window:
* Bar chart
* Click the graph button in the bottom-left corner of the screen to start creating graphs. You will find the same graph button in the graph window. Use this button to switch between horizontal and vertical bar charts.
* Using the pull-down menu, you can sort the graph from lowest to highest, highest to lowest, highest to lowest starting in the middle, or alphabetically.
Scatter Plot:
* To create scatter plot graphs you need to select two variables or indicators: (i) bookmark an indicator by clicking the star button (see also Indicator window below), (ii) select another indicator, (iii) select the scatter plot graph button in the graph window.
* Using the pull-down menu, you can show or hide the trendline. The slope of the trendline is shown below the pull-down menu. Move the mouse over the slope to see the trendline equation. (See also the Wikipedia article Linear regression)
Adjust graph scale:
* you can adjust the graph scale by selecting and editing the values. The graph updates as you type.
Table window:
* Click the table button in the bottom-left corner of the screen to get a data table of the selected indicator. If an indicator has been bookmarked, the data for this indicator will also be displayed. The table also shows the mean, standard deviation and range.
Copy table:
* You can copy the entire table into Excel using the copy button, and then selecting paste in Excel. If you do not have Excel, you can also do the following: (i) paste the data into a basic text editor such as Notepad, (ii) save the document as data.html, (iii) open the file using your Web Browser.
Define custom region:
* You can select more than one country in the table by holding down the shift or ctrl key. When you have selected the countries you are interested in, press the Custom Region button as shown below.
Selecting a country:
* A country can be selected either on the world map (by moving the mouse over the country), by clicking on the country in the table, or by moving the mouse over the visual representation of that country in the bar chart or scatter plot. Whichever way you select a country, the effect will be the same and the country will also be highlighted in the other windows. For example, selecting a country in the table will also highlight the country in the graph and on the map.
General options:
* Change the number of decimal places shown.
Adjust the map/graph scale: StatPlanet automatically adjusts the map and graph scale to suit the data set. However, in some cases you may wish to keep it fixed, for example if you made some changes to it yourself. You can set (or prevent) the automatic updating of the map/graph scale on (i) changing indicator, (ii) changing region, (iii) changing year. The default setting is for StatPlanet to adjust the scale when changing indicator or region, but not year. If you have chosen to not have the map scale updated, the map legend has a shortcut which you can use to refresh the map legend at at any time for the current indicator, year and region:
* Choose to view statistics as percentiles.
Customize appearance:
Set the animation duration:
* Change the map colours (map background, map borders, map text colour, map text outline colour, etc.)
* Change the size of map text
* Change the size of map symbols (for the proportional symbol map).
Requirements:
* Flash Player
The license of this software is Freeware, you can free download and free use this graphing software.