|
Spekwin32 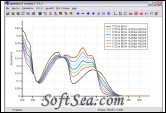
|
Spekwin32 is a multiformat spectra viewer & processor for UV-VIS, IR, Raman, fluorescence. One of Spekwin32's main goals is the consistent display of spectra coming from different sources. At the moment, 16 different spectral file types from commercially available spectrometer systems can be read. Spekwin32 is able to handle UV/VIS, fluorescence, NIR, IR and Raman spectra while the main focus is on UV/VIS and fluorescence.
This software allows to do many tasks on spectra that come across in the laboratory everyday life (baseline correction, spike removal, normalization, smoothing, averaging, integration, finding peaks, calculation of concentration, absorption coefficient and oscillatory strength, ...).
As important features for fluorescence spectroscopy there are: calculation of degree of polarization, Center of gravity, fluorescence quantum yield; correction of excitation intensity of fluorescence spectra, calculation of excitation spectra from two-dimensional fluorescence spectra, Displaying two-dimensional fluorescence spectra (EEM) from fluorescence or excitation spectra.
To simulate absorption spectra, there is an algorithm that allows to fit any group of curves (Gauss type) to present spectra.
For simple documentation, any number of spectra can be saved together as prorietary Spekwin32 binary file or as two sorts of human readable ASCII files (*.dat and *.csv). Spectral data can also be exported into two commonly accepted spectra file formats: JCAMP-DX and THERMO Galactic/GRAMS spc files. The current plot can be printed, copied to the clipboard or saved as graphics (WMF, GIF, TIFF, BMP, PNG). For LaTeX freaks, Gnuplot parameter files and data files can be created that allow to produce EPS files directly.
Spekwin32 Features:
Plot:
1. Fast scaling, zooming, rescaling with mouse
2. Status bar at bottom displays current mouse position => fast reading of data points
3. X-axis as wavelength, wavenumbers or electron volts, complementary second x-axis possible
4. Y-axis as transmittance, absorbance, molar absorption coefficient and log(absorption coefficient)
5. Automatic choice of axis types on reading spectral data files
6. Free axis caption, font, font size
7. Grid mode
8. Spectra display with arbitrary colour, line type, line width
9. Display of two-dimensional fluorescence spectra (EEM)
10. Drag&Drop for Spekwin32-readable files
11. Changing and saving many options in configuration dialog
Data import, Graphics/Data export:
1. Import of spectra from a multitude of spectrometers systems:
* Galactic GRAMS Software (*.spc)
* Perkin Elmer UV/VIS, fluorescence & Raman spectrometers (*.sp)
* Avantes AvaSoft Software (*.tat, *.tit, *.trt, *.ttt)
* Varian Cary 50 (*.csv)
* Hewlett Packard 8453 (*.csv)
* Scinco Neosys 2000 UV/Vis spectrometer (*.csv)
* Bio-Rad FTS 3000 MX FTIR spectrometer (*.csv)
* WTW photoLab spectral software (*.csv)
* Milton Roy Spectronic 3000 (*.asc)
* IKS XDAP (*.spk)
* Roper Scientific / Princeton Instruments WinSpec/WinView Software binary files (*.spe)
* Princeton Instruments WinSpec 1.6-Software ASCII files (*.prn)
* UV/VIS/NIR/IR- and Raman-spectra in JCAMP-DX 4.24/5.00 standard (*.dx, *.jdx)
2. Graphics export as WMF, GIF, PNG, TIFF or BMP via Clipboard or printer
3. Data export as:
* ASCII file, 2 variations (*.dat and *.csv)
* Gnuplot parameter file
* THERMO Galactic/GRAMS *.spc file
* JCAMP-DX file (*.dx) or as
* space-saving Spekwin32 binary file
Processing of Spectra:
1. Baseline Correction
2. Spike Removal
3. Correction of fluorescence spectra
4. Normalization
5. Smoothing
6. Finding Peaks
7. Changing of legend captions
8. Cutting partial spectra
9. Sorting spectra / changing order
10. Delete spectra
Calculations from Spectra:
1. Addition, subtraction, multiplication, division of spectra with each others
2. Addition, subtraction, multiplication, division of spectra with constant values in x- and y-axis
3. Averaging
4. Differentiation (1. - 4. order)
5. Integration
6. Concentration from absorbance& absorption coefficient
7. absorption coefficient from absorbance& Concentration
8. Oscillatory strength
9. Effective absorbance
10. transmittance / reflectance spectra from two intensity spectra
11. Center of gravity (with fluorescence spectra)
12. Fluorescence quantum yield (temperatur dependence possible)
13. Degree of polarization
14. Reduced spectrum from S and P polarized spectra
15. Calculation & displaying of two-dimensional fluorescence spectra
16. Calculation of excitation spectra from two-dimensional fluorescence spectra
17. Fit of Gauss curves to present spectra / simulation of spectra with Gauss curve
Please Note: this software is free for non-commercial or academic and educational use only.
The license of this software is Freeware, you can free download and free use this cad software.