|
PerfView 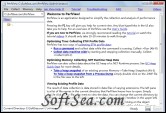
|
PerfView is an application designed to simplify the collection and analysis of performance data. It is a performance analysis tool focusing on ETW information (ETL files) as well as CLR memory information (heap dumps). It can collect and view ETL files as well as XPERF CSV files.
Powerful grouping operators allow you to understand performance profiles in ways other tools cant. PerfView is used internally at Microsoft by a number of teams and is the primary performance investigation tool on the .NET Runtime team.
Optimizing Time: Collecting ETW Profile Data
PerfView has two ways of collecting ETW profile data :
1. Run a command and collect data while the command is running. Collect->Run (Alt-R)
2. Collect data machine wide by starting and stopping collection manually. Collect->Collect (Alt-C)
Optimizing Memory: Collecting .NET Runtime Heap Data
PerfView can also collect data about the GC heap of a .NET Runtime process. Take a heap snapshot of an existing process Memory->Take Heap Snapshot (Alt-S). To Take a heap snapshot from a Process Dump simply double click on the .DMP file in the file view to the left.
Viewing Existing Profile Data
The result of data collection is data stored in data files of varying extensions. The left pane is a list of file names in the current directory that PerfView knows how to open. Simply double click on the file of interest to view the data. You can change the current directory by either double clicking on a subdirectory or typing the name in the textbox in the upper left.
If the file contains more than one view of the data then double clicking on the object populates children nodes in the treeview. Double clicking on one of the children will open the viewer for that view. Right clicking and selecting 'Help on Item' will take you to the help for that particular entry in the viewer. There are two main viewers of profile data:
1. A stack viewer which allows aggregation and filtering of events with associated stack traces.
2. An event viewer which allows filtering of time based events.
Requirements:
* .NET Framework
The license of this software is Freeware, you can free download and free use this diagnostic software.