|
Microsoft Debug Diagnostic Tool (64-bit) 
|
The Debug Diagnostic Tool is designed to assist in troubleshooting issues such as hangs, slow performance, memory leaks or fragmentation, and crashes in any Windows user-mode process. The tool includes additional debugging scripts focused on Internet Information Services (IIS) applications, web data access components, COM+ and related Microsoft technologies.
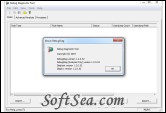
The main window of the tool has three different tabs used for data collection and analysis. For data collection, rules are configured for the type of problem you are troubleshooting. The advanced analysis portion of the tool is used to analyze and report helpful information on the data that is collected. There is also a Processes view that allows you to view processes, collect dumps, and stop processes that are running on the machine.
The three primary problems the tool aides in troubleshooting are process crashes, process performance, and memory leaks.
1. Process Crashes
The crash monitoring feature is designed to help determine why a process terminated unexpectedly. Similar to previous debuggers it will attach to a specific process and will monitor the process for multiple types of exceptions that cause a process to terminate unexpectedly. When a crash occurs, a full memory dump file will be created, in the directory specified when setting up the crash rule, for troubleshooting.
2. Process Performance
The performance monitoring feature is designed for troubleshooting performance issues for a specific process, or slow HTTP Response times. To troubleshoot slow HTTP Response times, a performance rule is created where a specific URL is monitored. If the URL does not respond in the configured time a process dump will be generated for the processes configured in the performance rule. A manual hang dump can also be generated by right clicking a process in process view and choosing create full dump.
3. Memory Leaks
The memory leak monitoring feature is designed to track memory allocations for a process. This feature should be used when a process on the system continues to grow in memory until the system becomes un-stable, or the process stops functioning correctly. The debug tool will inject a DLL into the specified process and monitor memory allocations over time. A dump is then generated, and the dump is analyzed to determine what allocations are not being freed and most likely causing the memory leak. Allocations generally fall into 3 groups: caching, short term allocations that will be freed later, and memory leaks. All three allocation methods have very distinct allocation patterns when measured over time. The leak tracking feature calculates a leak probability using a formula that is based on these allocation patterns as measured over a specific time period.
The tool also provides an extensible object model that exposes information necessary to analyze crashes, hangs and memory leaks. The object model is implemented in the form of COM objects and provides a script host with a built-in reporting framework.
Algorithmic analysis of issues will be built using ASP style scripts written using VBScript or Jscript that consume the object model and provides an easily understandable and actionable summary of the problem using a built-in reporting framework.
The license of this software is Freeware, you can free download and free use this diagnostic software.
