|
Microsoft Debug Diagnostic Tool (32-bit) 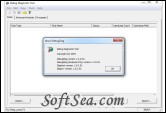
|
Microsoft Debug Diagnostic Tool (32-bit) is designed to assist in troubleshooting issues such as hangs, slow performance, memory leaks or fragmentation, and crashes in any Windows user-mode process. The tool includes additional debugging scripts focused on Internet Information Services (IIS) applications, web data access components, COM+ and related Microsoft technologies.
The main window of the tool has three different tabs used for data collection and analysis. For data collection, rules are configured for the type of problem you are troubleshooting. The advanced analysis portion of the tool is used to analyze and report helpful information on the data that is collected. There is also a Processes view that allows you to view processes, collect dumps, and stop processes that are running on the machine.
After launching the DebugDiag.exe executable, a wizard appears allowing the user to configure rules which are designed to assist in troubleshooting crashes, hangs, and memory leaks.
The program consists of three primary tabs (views):
1. Rules Tab
This tab allows the user to add, edit, and delete rules which govern the type of monitoring and diagnostics the user wishes to execute, as well as obtain the current status of any active or inactive rules.
2. Advanced Analysis Tab
This tab allows the user to select previously created memory dump files (.DMP) for detailed post mortem analysis using a series of ASP style scripts which analyze and report results in the form of a compressed html (.MHT) report file. Additionally, you may also select multiple memory dump files in which to analyze.
3. Processes Tab
This tab displays a list of processes currently running on the machine as well as detailed information for each individual process. There are also a variety of things the user can perform for each process accessible via the context menu. For example, to bypass the memory leak wizard (available via the Rules tab) and track a memory leak manually, simply right click the process you wish to monitor and select "Monitor For Leaks". This will inject leaktrack.dll into the process and begin the leak monitoring process. To ensure the data collection is accurate, allow the process to run for at least 1 hour after you begin monitoring for leaks and leaktrack.dll is injected. Once this is done, select the process where monitoring was previously enabled, then create a full memory dump by right clicking the process and selecting "Create Full Dump". This will create a full user dump and place it in the "Logs\Misc" folder under the directory where the tool was installed, which can be analyzed later via the Analyzer Tab mentioned above.
The license of this software is Freeware, you can free download and free use this diagnostic software.