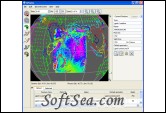
GPlates

GPlates Screenshot
  • Rating:
  • Version: 1.1.1
  • Publisher: www.gplates.org
  • File Size: 64.37 MB
  • Date: Jan 27, 2012
  • License: Free
  • Category:
GPlates Download
Free Download GPlates 1.1.1

GPlates is desktop program for the interactive visualisation of plate-tectonics.

GPlates offers a novel combination of interactive plate-tectonic reconstructions, geographic information system (GIS) functionality and raster data visualisation. GPlates enables both the visualisation and the manipulation of plate-tectonic reconstructions and associated data through geological time. GPlates runs on Windows, Linux and MacOS X.

The Goals of GPlates
1. to handle and visualise data in a variety of geometries and formats, including raster data
2. to link plate kinematics to geodynamic models
3. to serve as an interactive client in a grid-computing network
4. to facilitate the production of high-quality paleo-geographic maps.

GPlates is developed by an international team of scientists, professional program developers and post graduate students at:
1. the EarthByte Project (part of the AuScope National Collaborative Research Infrastructure Strategy (NCRIS) Program) in the School of Geosciences at the University of Sydney (under the direction of Prof. Dietmar M ller)

2. the Division of Geological and Planetary Sciences at CalTech (under the direction of Prof. Michael Gurnis)

3. the Centre for Geodynamics at the Norwegian Geological Survey (NGU) (under the direction of Prof. Trond Torsvik).

Collaborating scientists at the University of Sydney, the Norwegian Geological Survey and CalTech have also been compiling sets of global data for plate boundaries, continental-oceanic crust boundaries, plate rotations, absolute reference frames and dynamic topography.

GPlates is free program (also known as open-source software), licensed for distribution under the GNU General Public License (GPL), version 2.

GPlates Features:
Loading and saving geological, geographic and tectonic feature data:
Loading feature data from the following formats:
1. GPML / compressed GPML
2. Plates4 line-format
3. ESRI Shapefile (including the capability to map shape attributes in a Shapefile to feature properties in GPlates on a user-specified, per-Shapefile basis)
4. GMAP VGP (Virtual Geomagnetic Pole) data files.

Saving feature data in the following formats:
1. GPML / compressed GPML
2. Plates4 line-format
3. ESRI Shapefile
4. GMT “xy” format, with a variety of options for headers

Loading and saving reconstruction poles (finite rotations which enable geological, geographic and tectonic features to be reconstructed through geological time):
Loading reconstruction poles from the following formats:
1. GPML / compressed GPML
2. Plates4 rotation-format
3. Saving reconstruction poles in the following formats:
4. GPML / compressed GPML
5. Plates4 rotation-format

Displaying raster images:
Loading raster images in JPEG format, including time-sequences of raster images, to enable visualisation of “gridded” geophysical data such as mantle density anomalies, mantle convection-driven dynamic surface topography and the crustal age or spreading rate of the ocean floor — both:
1. Global raster images, which are assumed to cover the whole globe, from -180 to +180 degrees longitude and -90 to +90 latitude, and
2. Smaller rasters with a user-specified surface extent

Viewing feature data and raster images in a graphical display:
Displaying geological, geographic and tectonic features, as well as raster images, on the globe, in any of the following map-projections:
1. 3-D Orthographic Globe
2. Rectangular
3. Mercator
4. Mollweide
5. Robinson
6. Moving and re-orienting the camera (the viewpoint of the user), by “dragging” the mouse on the globe, using the keyboard arrow keys, or specifying the desired viewpoint in a dialog box
7. Activating a full-screen presentation mode, by pressing F11 to switch to a minimalist interface ideal for demonstrating data and animations on digital projectors
8. Zooming the camera, using the scroll-wheel of the mouse, the Zoom In tool, or the slider on the right-hand-side of the reconstruction view
9. Choosing different colouring schemes for features
10. Exporting a 2-D geometry snapshot of the current projected contents of the reconstruction view in Scalable Vector Graphics (SVG) format, for later viewing in a web-browser or vector-graphics editor such as Adobe Illustrator

Calculating and displaying plate-tectonic reconstructions:
* Reconstructing features to a desired geological time-instant, or animating over a period of geological time

Exporting “reconstructed geometries” (feature geometries at a particular reconstruction time in the past) in the following formats:
1. ESRI Shapefile
2. GMT “xy” format, with a variety of options for headers
3. Calculating velocity fields according to plate motions

Exporting “data animations” — each frame of a reconstruction animation saved automatically to disk in a sequence of files:
1. All reconstructed feature geometries (as GMT .xy files or Shapefiles)
2. A 2-D vector graphics snapshot of the view (as SVG files)
3. All velocity fields (as GPML files)
4. Resolved topologies as a sequence of static polygons (as GMT .xy files)

Interacting with features graphically:
1. Choosing a feature, to query or edit its properties, by clicking upon its displayed geometry
2. Digitisation of new geometries for the creation of new features
3. Modifying the geometry of a feature interactively by dragging vertices, inserting vertices or deleting vertices
4. Measuring distances, along the geometry of existing features, during digitisation, or between arbitrary user-chosen points on the globe.
5. Tabular display of data:

Listing tables of reconstruction poles (finite rotations) for the current reconstruction time:
1. Relative and equivalent rotations for each plate
2. A tree-like representation of the rotation hierarchy
3. The circuit between any plate and the stationary reference frame
4. Exporting tables of reconstruction poles in CSV (comma-separated value) format, for later viewing in a spreadsheet such as Microsoft Excel.
5. Listing tables of Shapefile attributes on a per-file basis, with one attribute per column
6. Modifying reconstructions graphically:
7. Manipulation of reconstruction poles by dragging the mouse cursor to move plates, including the capability to constrain the latitude during the interactive adjustment.

Interactive plate-boundary closure, enabling GPlates to generate plate-tectonic boundary conditions for geodynamic models in program such as:
1. The widely-used, open-source, spherical mantle-convection package CitComS
2. The next-generation AuScope-funded mantle-convection package Underworld.

The license of this software is Free, you can free download and free use this presentation software.

Presentation Software Related Downloads: